Located along the infamous Ring of Fire, Washington state experiences an earthquake about once every eight hours1. As an underwriter, chances are you have a number of risks on or near a fault line — over 100 known faults crisscross Western Washington and Oregon.
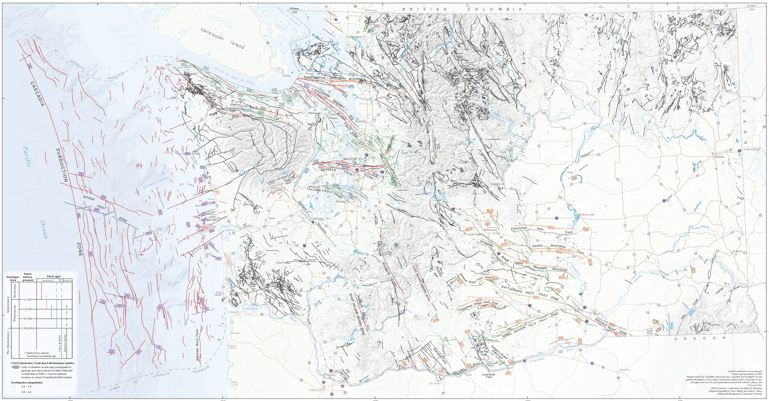 Washington state has more than 100 known fault lines.2
Related:
A Closer Look at Earthquake Risk in Washington State
The city of Seattle is located directly over a fault — a hazard first recognized as a serious problem in 1992. The South Whidbey Fault cuts through Seattle’s northern suburbs and as far as North Bend and is capable of producing an earthquake as severe as magnitude 7.5.3
The distance from that or another fault to a risk you insure is important, but it’s not the only factor in determining a risk’s potential damage from an earthquake. Another key factor is the land on which a building resides, and this is where soil liquefaction comes into play.
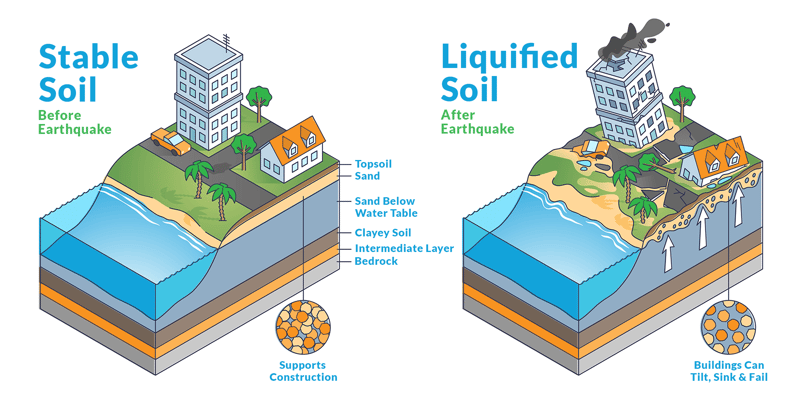
What is soil liquefaction?
When soil becomes saturated with water, it enters a state known as liquefaction where it stops acting like a solid and starts behaving like a liquid. If you’ve ever spent time at a beach, you’ve seen liquefaction in action.
Normally, soil consists of densely-packed particles, like the firm ground far from the shore. The particles exert force on one another, and this force holds them in place and creates strength. During an earthquake, the shaking increases groundwater pressure on soil particles, forcing them apart. Water saturates the packed soil, forcing particles farther apart and softening and shifting the soil, like the beach sand close to the water.
Like sandcastles at high tide, structures on liquefied soil can buckle, break and even sink. Some soils are more susceptible to liquefaction than others. For example, it takes less water to liquefy soil that’s already loose and sandy. And soils located at or below sea level are subjected to greater groundwater pressure during an earthquake.
What can you do about liquefaction?
If a structure is a new construction, you should check liquefaction susceptibility before you build. However, if a structure already exists, there are measures you can take to reduce the damage caused by earthquake-related liquefaction. Structures can be retrofitted and reinforced to reduce the impact of violent shaking, and the soil under and around them can also be densified, solidified, reinforced, drained, and/or dewatered.
All buildings in earthquake-prone areas can be strengthened through bracing, reinforcing masonry, sheer plating (such as adding plates of plywood to stud walls), and bolting walls to foundations. In the interior, it’s always a good idea to strap water heaters to the wall and secure heavy objects like bookshelves and mirrors to prevent them from falling when the building shakes.
How do you determine liquefaction risk?
Soil liquefaction maps can help you to pinpoint it, especially when combined with other data points, including the Modified Mercalli Intensity scale (MMI), tsunami risk, and fault line locations.
You can quickly and easily access all of these data points in our Earthquake Risks Tool. Just login to WSRB.com. Find detailed instructions on how to use the tool here.

[1] Pacific Northwest Seismic Network, https://pnsn.org/
[2] Washington State Department of Natural Resources, https://www.dnr.wa.gov/publications/ger_ofr2014-05_fault_earthquake_map.pdf?o91ywfh
[3] Washington State Department of Natural Resources, https://www.dnr.wa.gov/programs-and-services/geology/geologic-hazards/earthquakes-and-faults