Have you heard of wildfire hazard potential (WHP)? This publicly available data source was originally designed for forest managers and policymakers to help them make decisions about where to deploy resources. Now, there's a community version of it you can share with your customers to help them understand their wildfire risk.
Today, we talk with one of the co-developers of the WHP about what the data means. Greg Dillon is the Director of the Fire Modeling Institute, a program of the US Forest Service’s Rocky Mountain Research Station. The institute is housed at the Missoula Fire Sciences Lab in Missoula, Montana, the country’s only federal research lab focused exclusively on wildfire.
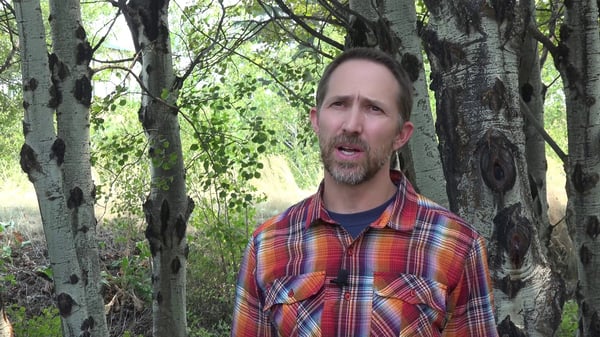 Greg Dillon, Fire Modeling Institute Director
Related:
Help Your Customers Prepare for Wildfire Season With Our New Tool
Dillon, along with other fire scientists, developed the WHP in response to the growing need for information about wildfire risk. Here, he shares a bit of the history of the WHP, but first, he tells us how you can use the WHP.
WSRB: How can insurance professionals use the WHP to help their customers understand wildfire risk?
Dillon: We recently launched a website called Wildfire Risk to Communities. There is an interactive map where you can search for a community and explore information about relative wildfire risk. There are also a lot of useful educational resources to help homeowners understand wildfire risk and reduce their risk.
WSRB: What spurred the creation of the WHP?
Dillon: There have been versions of this product going back to about 2007, and there was another data product before that, too. Over time, it became apparent that people — federal land managers, state land managers, policymakers and others — wanted spatial information about wildfire hazard potential. That’s why the WHP was born: to meet those needs.
We have a lot of useful data about wildfire occurrence and modeled fire probabilities, and the WHP is a way to integrate a lot of that information into a five-class map.
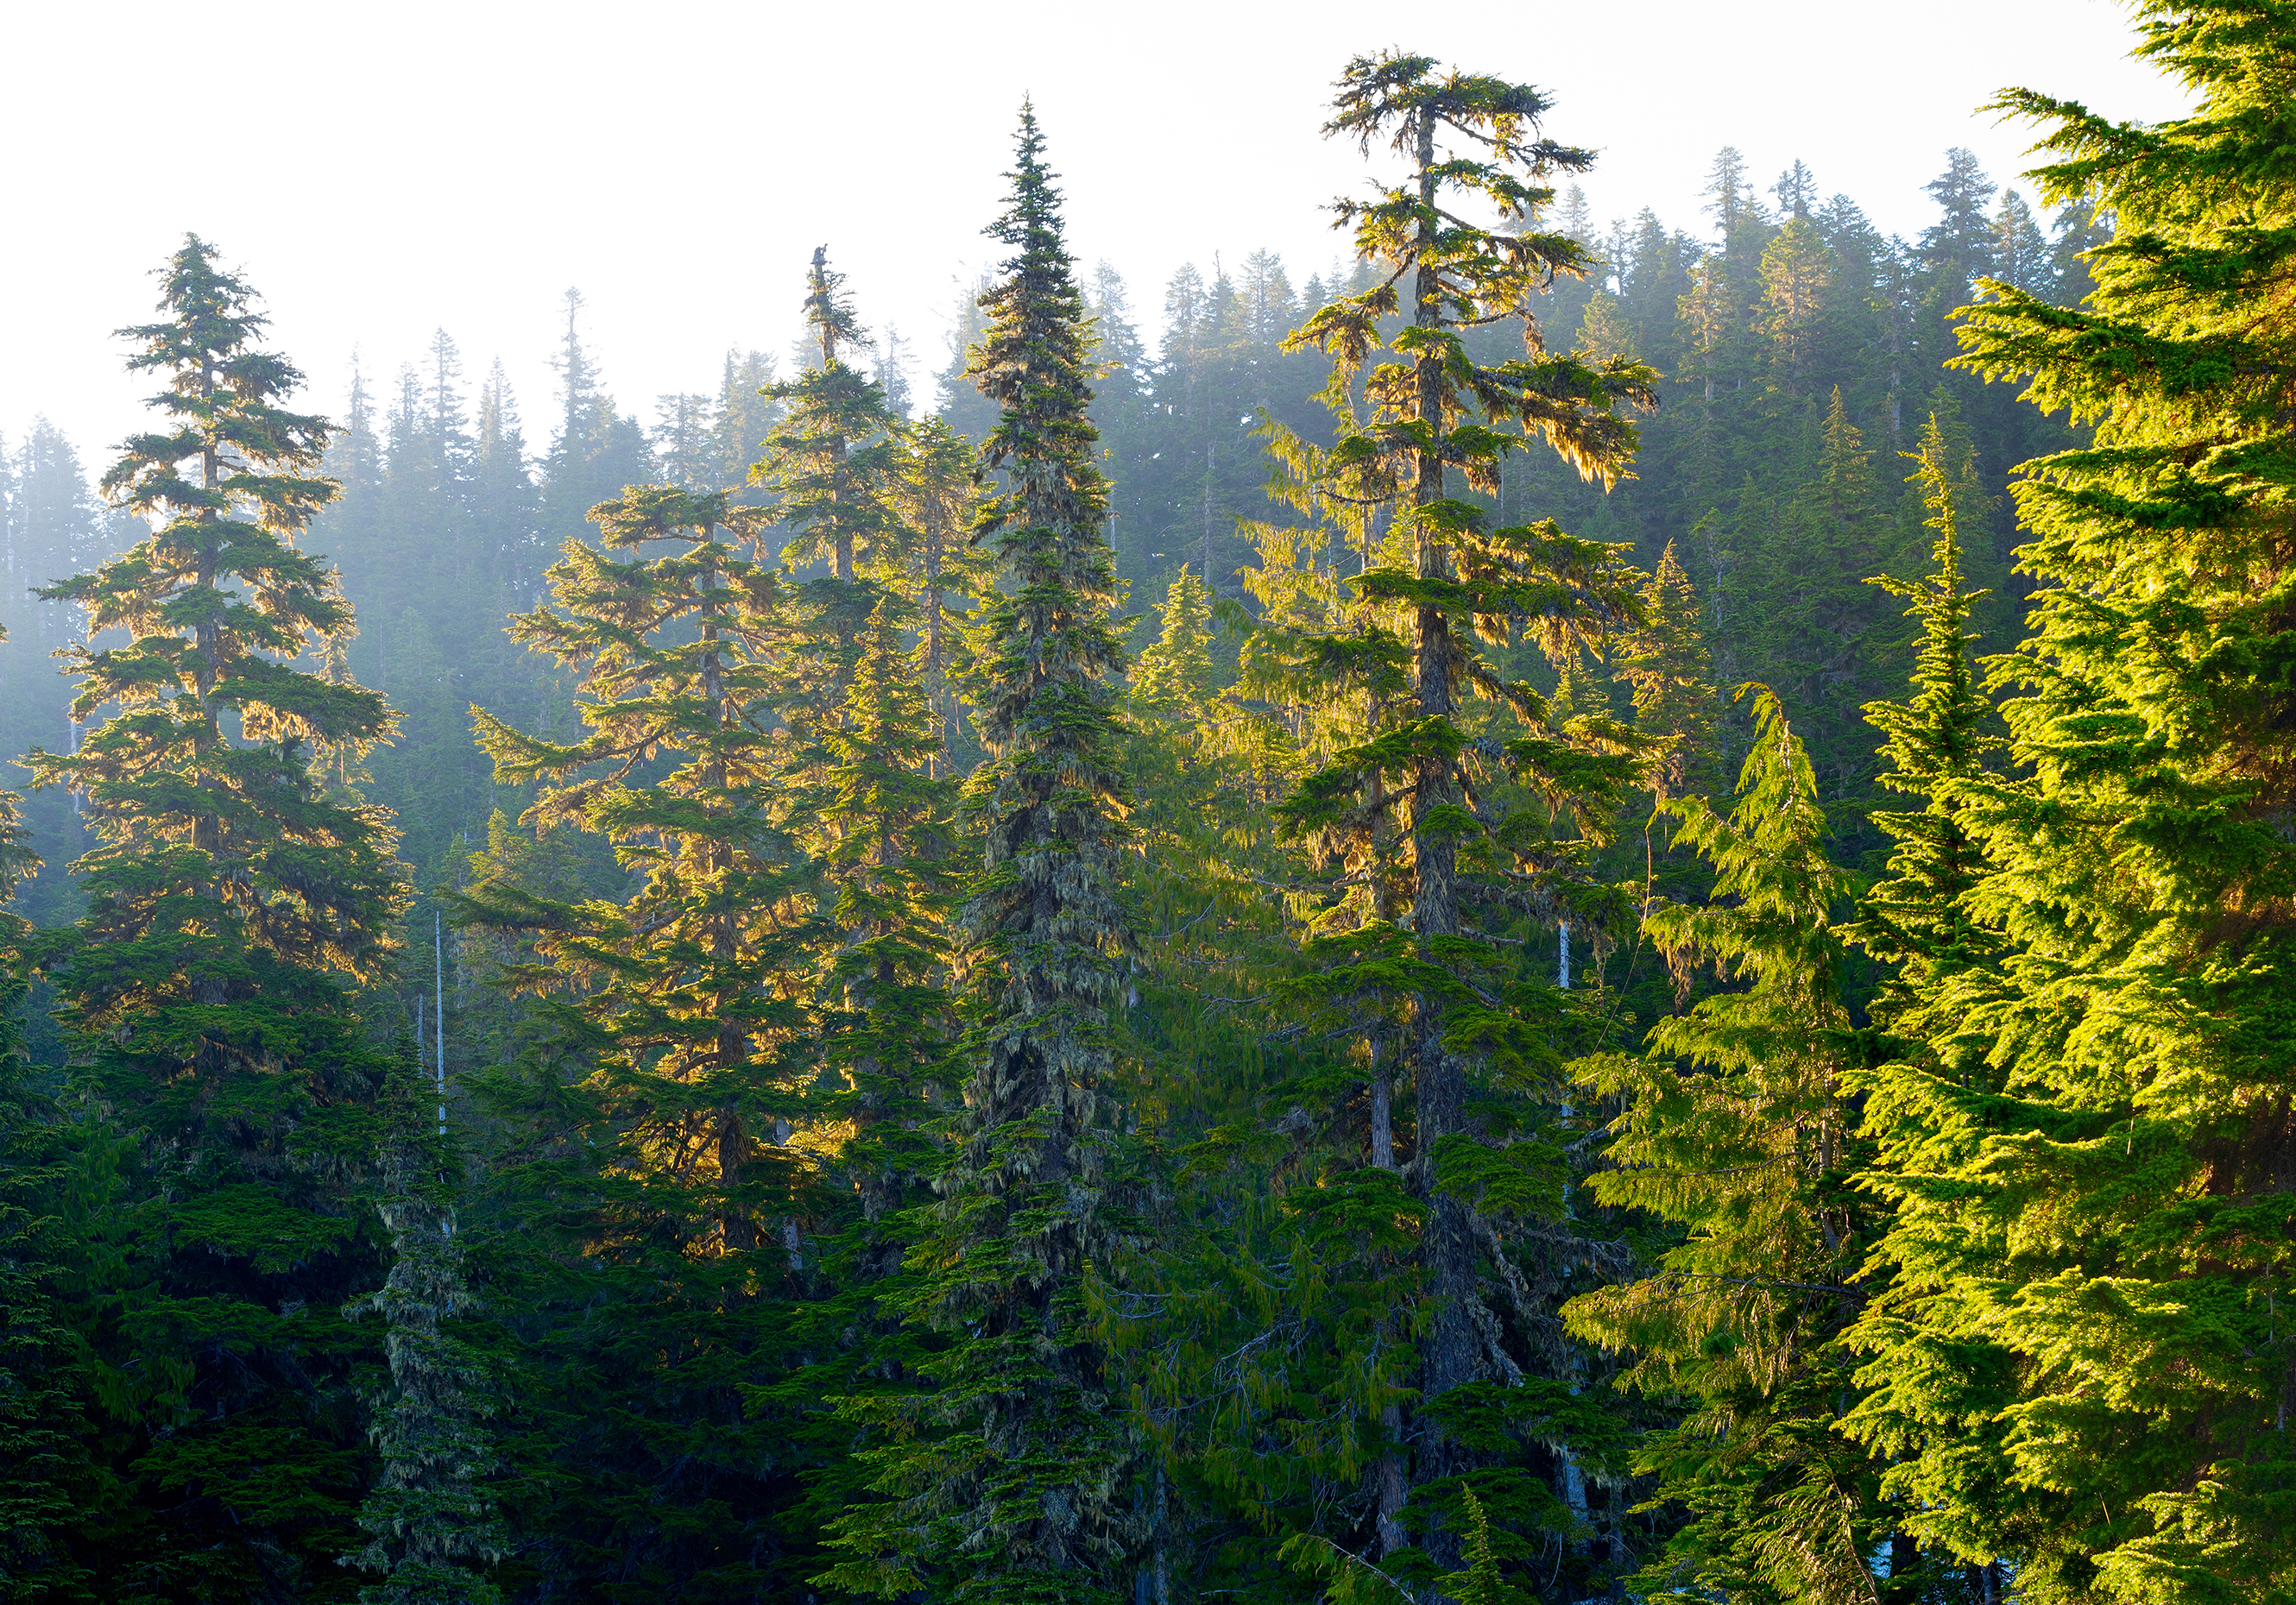
 The wildfire hazard potential helps forest managers and
policymakers deploy resources.
Related:
Three Myths About Wildfire Risk
WSRB: What does the WHP mean?
Dillon: It’s an index of wildfire hazard, but what does that mean, right? It’s intended to quantify the relative potential for a wildfire in any place that might be difficult to control.
By relative, I mean one area’s WHP is relative to other areas’ WHPs. The absolute value of a WHP doesn’t mean a lot. When you see “very high” and “high” WHPs, you’re looking at an area with a value in the upper percentile ranges of the index.
By difficult to control, I mean the probability of a fire happening and it being high intensity. We talk about intensity in terms of flame length. Places with the highest WHPs are those with a high likelihood of wildfire occurring and higher likelihood of longer flame lengths.
If you have an area with a high probability of fire but where flame lengths are on the lower end, we would consider that to be a place where suppression can be more effective, and so the WHP would be lower.
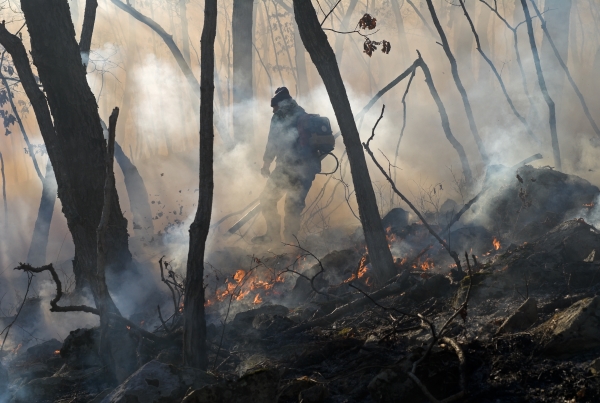
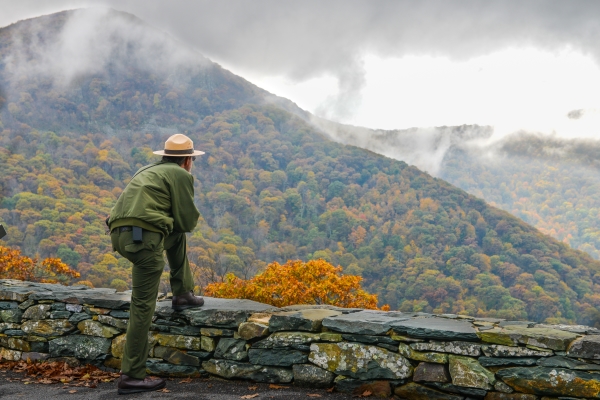
A number of Washington state communities face a high risk of wildfire.
Related:
Some Parts of the West Are Burning Again and Again
WSRB: What factors go into the WHP?
Dillon: We use a collection of input datasets. One set depicts fuel characteristics based on vegetation from the national LANDFIRE project. Another summarizes about 20 years’ worth of weather observations including temperature, humidity, wind, etc. We also look at where fires have ignited since the early 1990s when we have good records.
The next step is to run thousands of simulations on the computer. Each simulation is an iteration of a hypothetical fire season with different weather conditions and ignition locations.
The pattern of past ignitions is used to inform where ignitions are placed in the simulations during the model runs. Ignitions can occur anywhere in the landscape, but there is a higher probability of them happening where there were historic fires.
The simulator does its work in small regional polygons, about 130 across the U.S., that are tuned to statistical patterns in each region’s weather and fire occurrence in the last 20 years or so. The results of those simulations are used to construct the WHP.
If you want to learn more about the WHP, visit their website.