Calculating slope and determining related risk is a necessary component of insurance underwriting. But current methods of slope assessment are time-consuming and imprecise.
To make the lives of underwriters everywhere that much easier, we've been working to develop a new method of slope determination. SlopeScout® expedites the process and return accurate results in an easy-to-read format, empowering underwriters to make more informed decisions.
To see our tool in action, skip ahead by clicking here.

Tragedy strikes
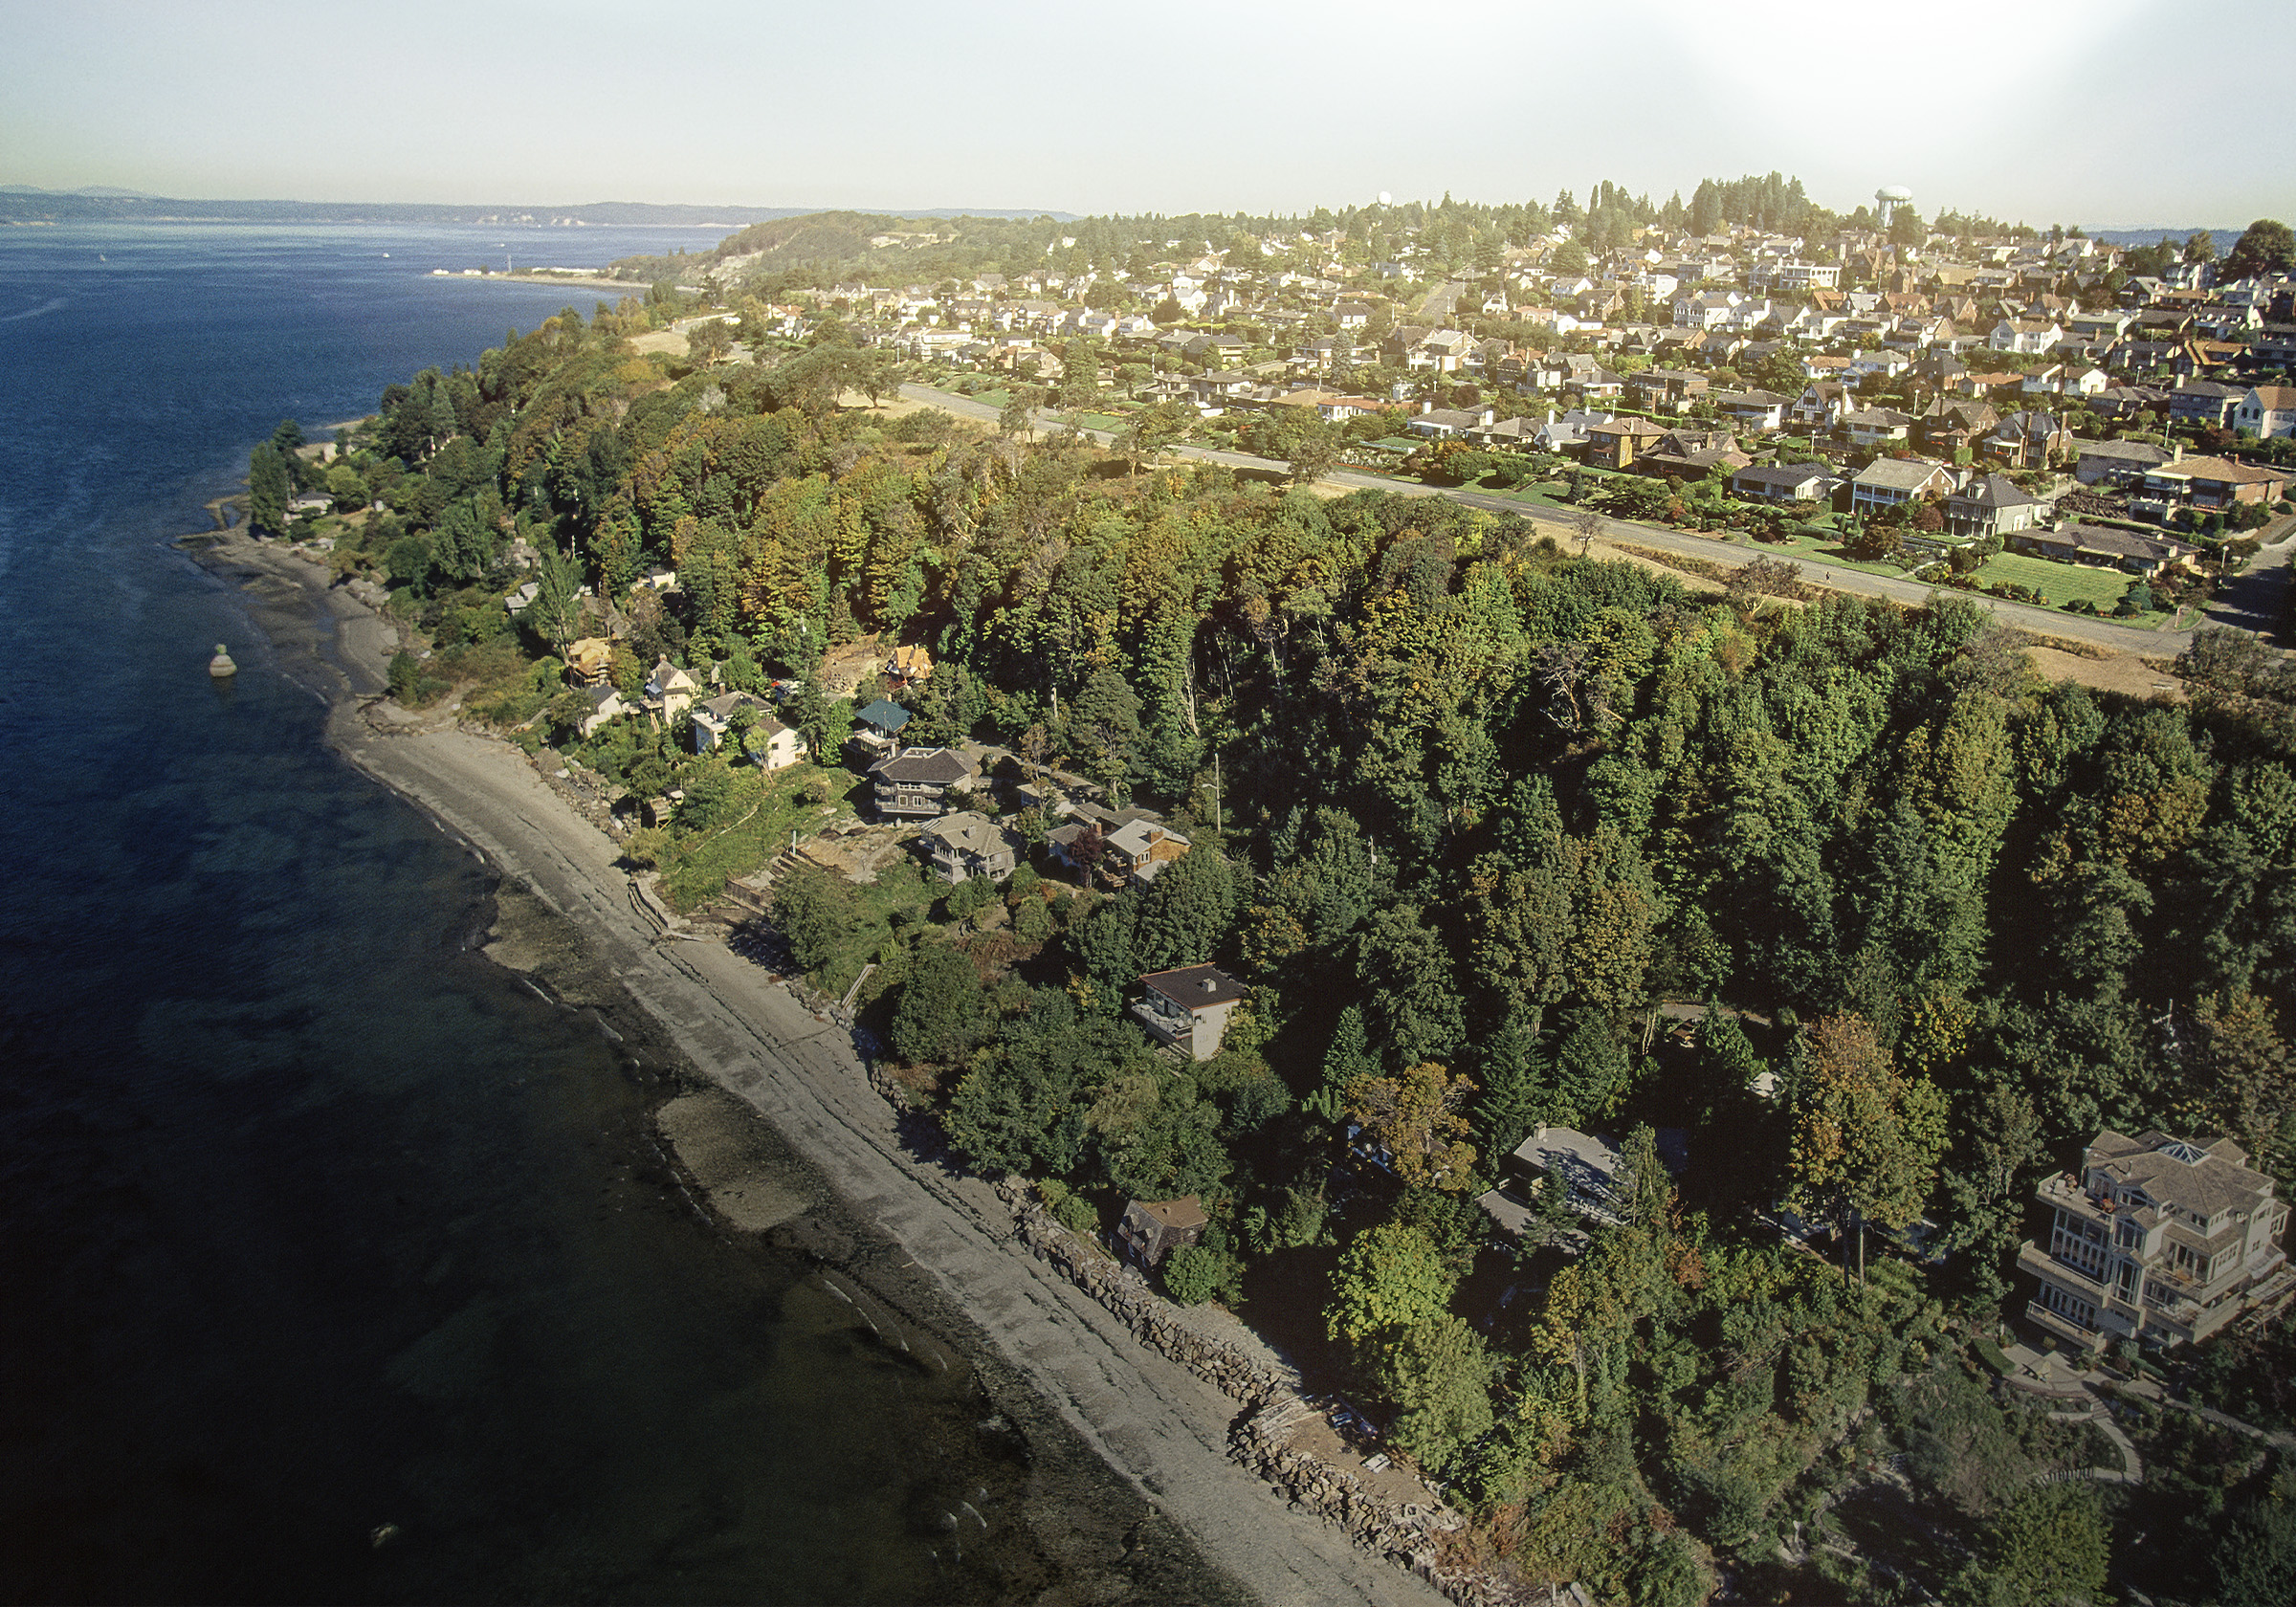
Washington state was hit with heavy storms during the winter of 2022. For most in the state, it meant flooding, heavy snows, and other inconveniences. However, for properties located on precipitous slopes, it meant the potential for total devastation. Such was the case at one home in Seattle.
During one particularly dramatic scene, a home at the 2400 block of Perkins Lane W. in the Magnolia neighborhood slid off its foundation and lurched 15-20 feet down the hillside. According to the Seattle Fire Department's report, “the steep slope area behind the house had slid likely as a result of high levels of precipitation, which resulted in the top floor of the structure partially collapsing on top of the daylight basement.”

Though landslides like this are rare, the position of the home in relation to the steep bluff made the property particularly susceptible. SFD was able to control the scene, stabilize the structure, and quickly extricate one of the homeowners who had become pinned under some of the debris. The two individuals in the home at the time both survived, but unfortunately, their dog perished during the event.
This event offers a fantastic opportunity to explore slope assessment strategies and highlight new technology to streamline this process for insurers. Let’s examine this property and see what we can learn.
Assessment of slope
Using widely available tools, such as Google maps, we can make a preliminary assessment of the property.

The position of the home, as viewed from the overhead map, does not immediately tell the whole story. Shoreline is not always the same and, while erosion and other forces can create sheer cliffs and weak landmasses, it requires further investigation to ascertain the level of risk.

Viewed from the street, you can get a feel for how the home sits within the space. The home is obviously on a slight slope – it’s raised up above the street by several yards. However, once again, the picture is incomplete. The forested area behind the home could hide any size or scale of slope, but the limited scope of the street photography leaves much to be desired.
To see the scale of slope, a topographic map can be used. Here is Google's version:

The topographic map shows the slope pretty well, but the home's site is somewhat obscured. We get the general feel for the slope but lack the specific positionality of the property in question.
Moving away from Google Maps, other tools can further reinforce the property risk. For example, the USGS has a publicly accessible landslide inventory documenting trouble areas throughout the United States.

As indicated by the large red patches on the USGS map, there is a sizable landslide risk in the area. Furthermore, the USGS has published landslide hazard information specifically regarding the Magnolia neighborhood (read more here).
With all this information, insurers can make informed underwriting decisions to ensure properties they insure are adequately covered.
However, this research is time-consuming and much of it amounts to little more than eyeballing. Presented with a long list of properties, and only so many hours in a day, underwriters need a quicker way to assess slope.
Quick and accurate
SlopeScout empowers underwriters to analyze slope with ease, enabling them to pinpoint structures geographically and in relation to the elevation of any property. Here is how it works.
The process starts by launching our elevation analysis interface. You're greeted by a screen featuring a topographic map and an address input box. Let's search for the Magnolia address which experienced the catastrophic landslide mentioned above.

Inputting the address takes us directly to the home in question. As you can see, each building footprint is outlined.

Clicking on "Start Slope Analysis" generates a bounding box around the selected building. This box includes the (A, B) and (C, D) lines intersecting at the home - everything within this box will be analyzed for elevation.
Slider bars enable you to alter the selected parameters of the bounding box; you can rotate it and change its width and length. For this example, let's rotate it to be in line with the street and reduce the length and width to focus more specifically on the property in question. Additionally, you can add a unique description to each report in the "Report Notes" box.

Once you are satisfied with your selection, click "Run Analysis."

In under a minute, an SlopeScout Elevation Analysis report is generated from your selection.
.jpg?width=800&height=1317&name=slopescout_analysis_report%20(1).jpg) Included in the SlopeScout Elevation Analysis report are the following items:
Included in the SlopeScout Elevation Analysis report are the following items:
Report Summary: Basic details including the report generation date.
Slope Map: Displays the building's footprint, bounding box axes, and slope degree map of the surrounding area.
Building Elevation Percent Slope: Reports slope percentages from different building edges (A, B, C, D), indicating terrain steepness and potential issues like erosion or drainage. Includes graphs showing elevation changes over distance (A-B and C-D), highlighting how the terrain rises or falls across the property (the dark blue section on the line graph indicates the selected building).
Additional Information:
- MMI (Modified Mercalli Intensity Scale): Earthquake intensity at the property.
- Lahar Presence: Risk of mudflows from volcanic activity.
- Soil Type: Impact of soil characteristics on earthquake effects.
- Liquefaction Susceptibility: Risk of soil liquefying during an earthquake.
- Tsunami Risk: Tsunami inundation area identification.
- Distance to Fault: Proximity to fault lines and related seismic risks.
- FEMA Flood Zone Designation: Flood zone status of the property.
From looking at the produced report, it becomes clear that this home sits in an extremely precipitous position. While the (A, B) line shows a small variation in elevation, the (C, D) line illuminates a much greater change. From top to bottom (the backside of the property to the front), there is an elevation change of over 100 feet, with a nearly 75% slope for over half of the selected area. That is a tremendous slope!
Click here for more information on how to read a SlopeScout Elevation Analysis.
Conclusion
Current and readily available methods of slope determination are effective but labor-intensive and require specialized training to review.
Now there is a much faster and more accurate way to do things as demonstrated by using SlopeScout - all it takes is an address with a building on it and a few clicks, and you gain total understanding of a property's elevation changes.
If you're having trouble accessing the tool, please reference our SlopeScout Help Center guides or contact our Subscriber Relationship Manager Scott Elliott.
[1] Seattle Fireline, https://fireline.seattle.gov/2022/01/07/landslide-in-magnolia-neighborhood/