
The question at the forefront of everyone’s mind – consumers, business leaders, insurers – is whether the economy is headed for a recession. Furthermore, how might a recession impact the insurance industry? Let’s dive in.
To skip ahead to the economic effect on insurance, click here.
The current state of the economy
The consensus is that the economy will tip into a shallow recession in the second half of 2023. But are we really sliding into a form of economic stagnation akin to the 1970s and early 80s?
Consumer and small business sentiment are well below average, pulled downward primarily by inflation concerns. Inflation spiked in 2022, peaking at 9.1% in June of that year. But consumers are already changing their tune and economic projections indicate a strong likelihood that inflation will moderate; it already is. Inflation is forecast to dip down to roughly 4% through 2023, and to fall even further to 2.5% in 2024.
The unemployment rate, which spiked to 14.7% at the beginning of the COVID pandemic, now sits at roughly 3.5%, the lowest it has been in over 50 years. Unemployment is expected to rise as the Federal Reserve implements rate hikes, with a projected peak unemployment rate of closer to 5% by early 2024. That said, 1.1 million jobs have already been added in 2023 alone, adding hope that the actual rate of unemployment in Q1 and Q2 of 2024 may be lower than currently expected.
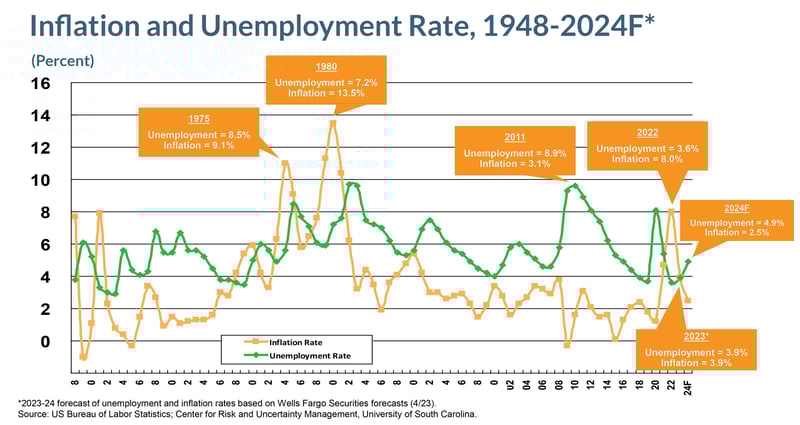
Things were much worse back in the early 1980s than they are today, with both the inflation and unemployment rates significantly higher back then. The unemployment rate spiked briefly during the COVID pandemic. However, the unemployment rate currently sits at generational lows.
Looking at the “Misery Index” (MI)– the sum of the unemployment rate and the inflation rate – we can see that things are not as bad as many seem to believe.
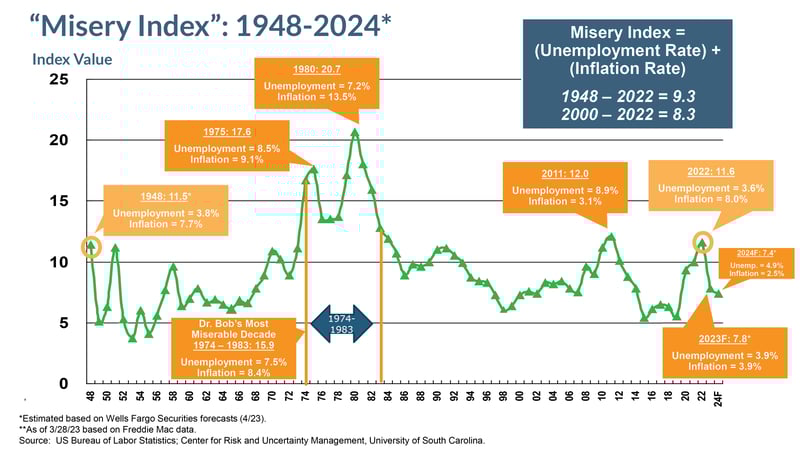
2022 had a MI rating of 11.6, close to the financial crisis peak in 2011. The MI in 2023, on the other hand, is projected to come in at 7.8, and decline further to 7.4 in 2024 as inflation falls and unemployment slightly increases.
From these metrics, the economy seems to be doing quite well. However, the threat of recession casts a long shadow.
Is a recession on the horizon?
Recessions are nothing new. In the past century, the US has experience 17 recessions. Are we headed for another?
The Wall Street Journal conducts regular surveys of economists, gauging the probability of a recession. In April 2022, the reported probability was 28%; in April 2023, that number hit 61%.
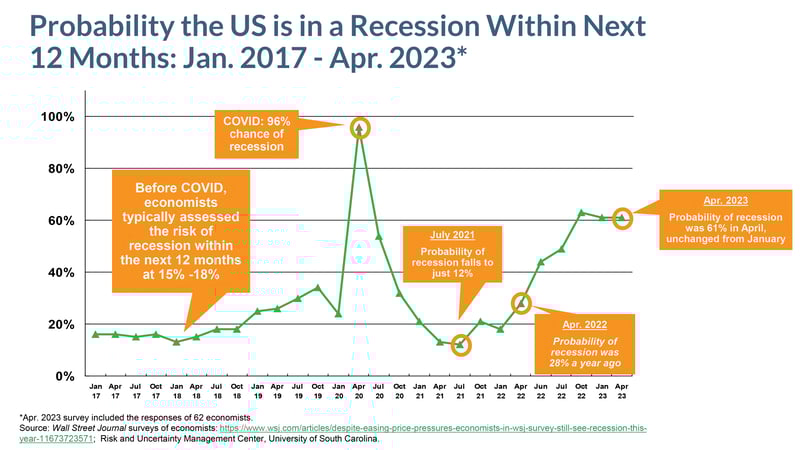
These predictions are little more than amalgamated opinion, and different economists and investment firms have varying views on the matter. Goldman Sachs, for example, set its estimated probability of recession within the next 12 months at 35% in March 2023, increased from 25% in February 2023.
It’s hard to know for sure which direction we are headed. However, there are several outcomes which could occur:
Soft Landing: a mild slowdown where consumer and investor spending declines slightly but growth continues; this is what the federal reserve is aiming to achieve.
Hard Landing: a sharp contraction in spending by consumers, resulting in significant job loss and decline in investment.
No Landing: a recession is avoided completely, and the economy continues to grow.
The current bank debacles plaguing the US economy have added a level of uncertainty to recession forecasts, with many pointing to soft or hard landings as probable outcomes. The Wall Street Journal asked economists which outcome they felt most likely: 24.1% said soft landing, 75.9% said hard landing.
Jay Powell, the Chair of the Federal Reserve, had this to say in May 2023:
“It’s possible that we can continue to have a cooling in the labor market without having the big increase in unemployment that have gone with many prior episodes.”
It’s all up in the air. My expectation is that a recession will likely occur later in 2023, but it will be more akin to a soft landing than a hard one. However, additional factors, including the potential for a debt default and banking crises, could exacerbate the problem.
The “X” Date
A major factor that could affect the likelihood of recession, the trajectory of interest rates, and the volatility of the financial market is the status of the US National Debt.
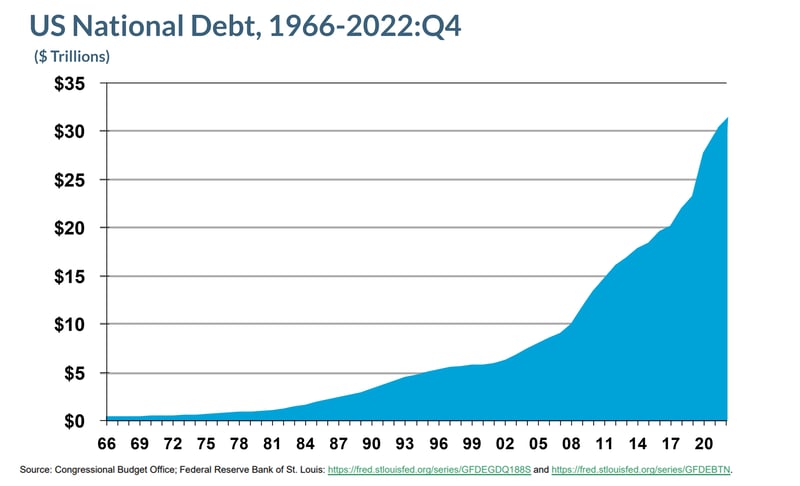
In January 2023, the national debt hit $31.4 trillion. The Congressional Budget Office released this statement in February 2023:
“If the debt limit was not raised or suspended, the Treasury would not be authorized to issue additional debt other than to replace maturing securities. That restriction would ultimately lead to delayed payments for some government activities, a default on the government’s debt obligations, or both.”
This doesn’t sound good. A default on debt obligations would carry with it a slew of consequences, including large cuts to spending, suspension of interest payments on existing debt, and destabilization of the US dollar. All this could come to pass if an agreement is not reached by the “X” date, a date which, according to Treasury Secretary Janet Yellen, could come as soon as June 1.
We are currently at a major debt limit impasse, something not seen since 2011. All this hoopla could cause interest rates to spike, stock indices and commodity prices to fall, and consumer confidence to take a nosedive.
Bank debacle
The current banking crisis, and contraction in credit, increase the likelihood of a recession.
Silicon Valley Bank, Signature Bank, and First Republic Bank recently failed, comprising the 2nd, 3rd, and 4th largest failures in US history.
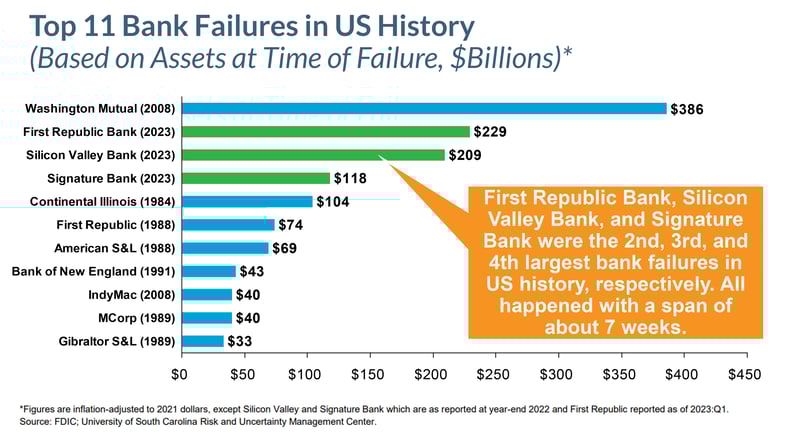
However, the reason these failures occurred is not indicative of some systemic problem, similar to what we saw during the Financial Collapse in 2008-09. These failures were due in part to individual operational problems: a lack of fundamental risk management that constituted an abdication of fiduciary responsibility. As such, the current banking crisis remains relatively contained.
This is not 2008.
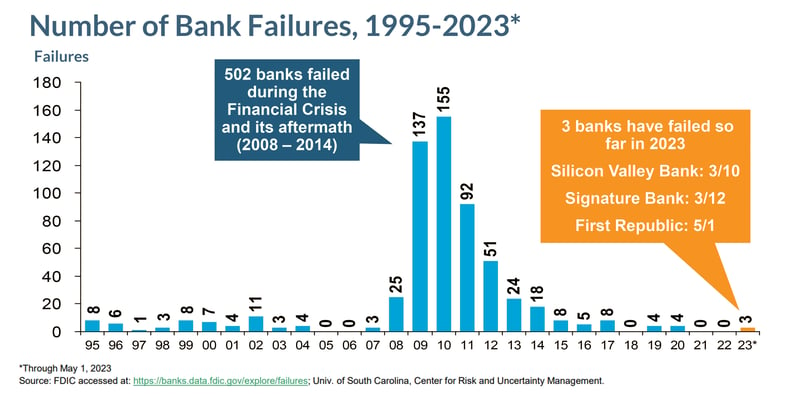
We’ve had very few bank failures in recent years, indicating that the banking industry might be more robust than it appears.
That said, the turmoil caused in recent months does increase the risk of recession.
Impact on insurance
What does this all mean for the insurance industry?
Property/Casualty insurance is often impacted by major events, with ROE, premium growth, and rate increases intimately connected with the state and trajectory of the economy.
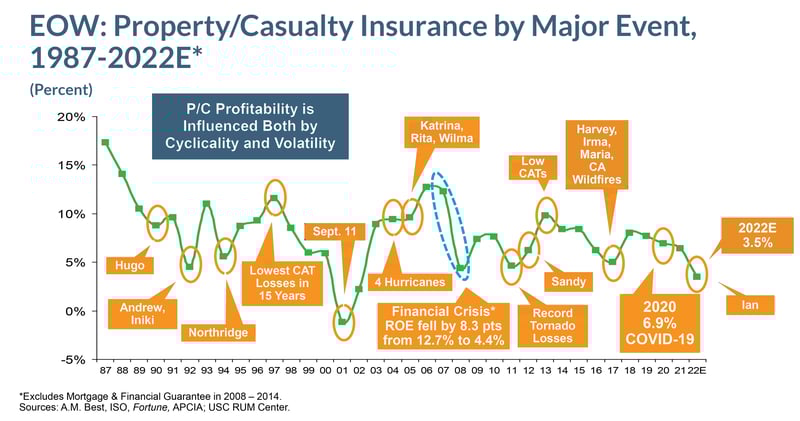
During the Financial Crisis of 2008, P/C ROE fell by 8.3 points from 12.7% to 4.4%. ROE has slipped in recent years, though much of this can be attributed to increasingly catastrophic weather events.
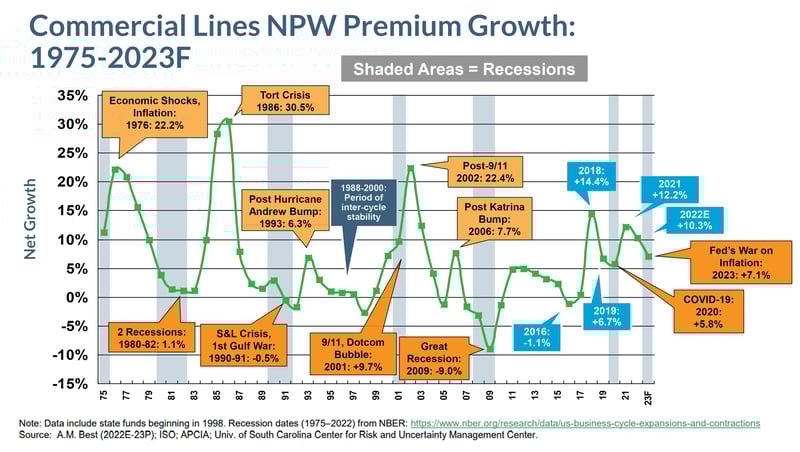
The past century has taught us that there is a strong relationship between the rate of change in Commercial Lines premium growth (more than in Personal Lines) and economic recession.
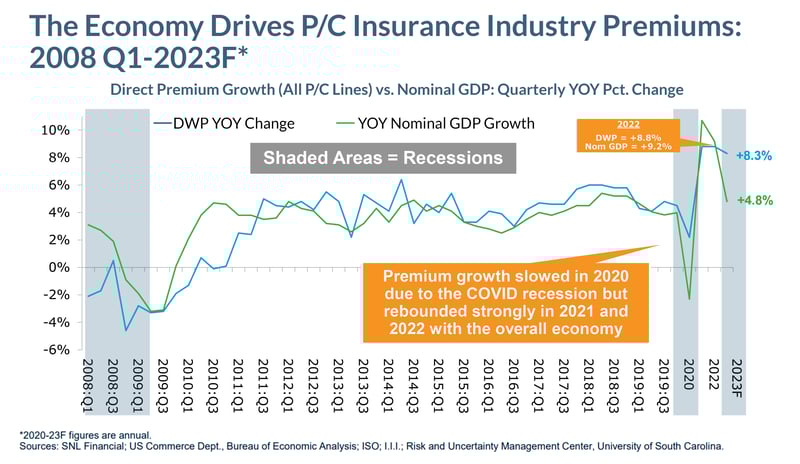
Additionally, P/C direct premium growth has a strong relationship with the overall growth in GDP. Over the past 15 years, the industry has mirrored the growth rate in the economy broadly, suggesting an intrinsic link between the two.
Rate increases, while driven, in part, by high CAT losses, are affected by inflation and other economic factors, including high reinsurance costs, lower interest rates, and increased economic uncertainty. It’s currently a hard market. The question is, if the economy heads towards recession, will this hard market continue?
Another question to consider is the impact of the current banking crisis on the insurance industry.
In 2022 alone, the industry suffered a $35.6 billion net underwriting loss, a $95.5 billion drop in policyholder surplus, an estimated $111 billion in unrealized capital losses, and a 45% decline in profit.
In the face of this, the insurance industry will remain stable for the fundamental reason that insurance companies operate differently than banks. For one, policyholders can’t intitiate a “run” on an insurer, withdrawing funds whenever they want – liabilities are satisfied by triggering events/claims. Insurers also invest and manage assets in a more conservative way.
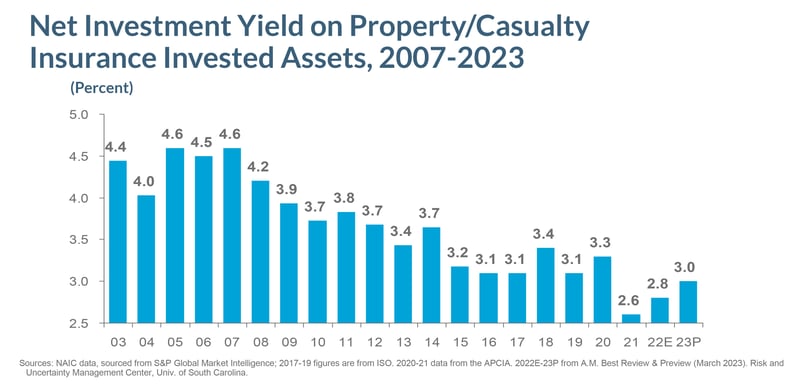
An additional consideration is the Federal Reserve’s interest rate hikes. For P/C insurers, higher interest rates mean higher amounts of investment income.
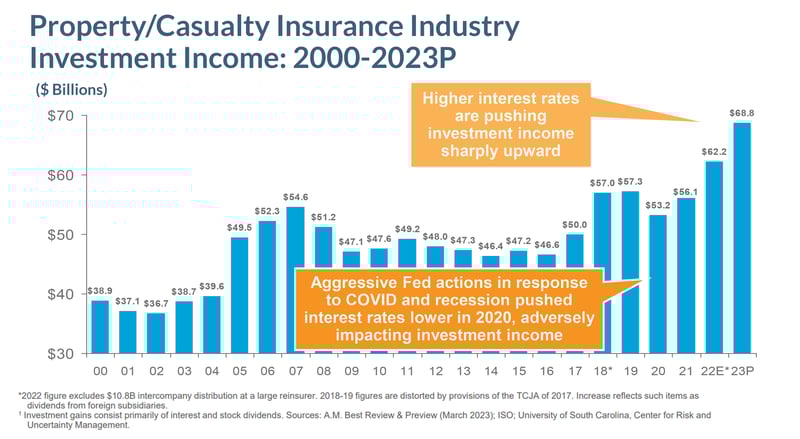
Back in 2021, the insurance industry had the lowest yield on investment portfolios in 60 years; this is starting to migrate back upwards.
Increased investment returns can help to partially offset claim severity pressures, which spiked in 2022.
Taking in all that we currently know, what’s the prognosis for the insurance industry going forward?
My expectation is that, should the economy head towards recession, the following impacts will occur:
- Overall P/C underwriting performance, based on data from the past 50 years, will be relatively unaffected by a recession.
- Commercial Lines NWP growth rates will be impacted, but the magnitude of effect will vary based on the extent of recession.
- ROEs will be impacted, as indicated by their performance during previous economic downturns. However, due to the current rise in interest rates and increased investment income, ROEs will likely rise as well.
- As P/C insurance demand slows, it will take pressure off the current hard market.
- Higher interest rates, resulting from financial market volatility, will lead to increased investment income for insurers.
Economic fears are a rational response to a myriad of factors, but there remains a silver lining: the insurance industry is strong in the face of uncertainty, providing ample cushion should the unexpected appear.