Tsunami inundation maps have become a critical tool to help plan evacuation routes and hazard mitigation, and pinpoint the locations of structures and populations most likely to be affected in the event of a tsunami.
Have you ever wondered how these locations are determined? The answer is probably much more complex than you imagine.
Intricate computer models are used to create tsunami inundation maps based on bathymetry (the measure of depths of bodies of water), topography, seismological studies, empirical evidence, and more.
Standard tsunami inundation mapping uses the Method of Splitting Tsunami (MOST) model, a set of numerical simulation codes. The MOST model addresses the three stages of tsunami development: generation by an earthquake, transoceanic propagation, and inundation of dry land. This information can be used to develop faster, more reliable data in the event of an offshore earthquake.
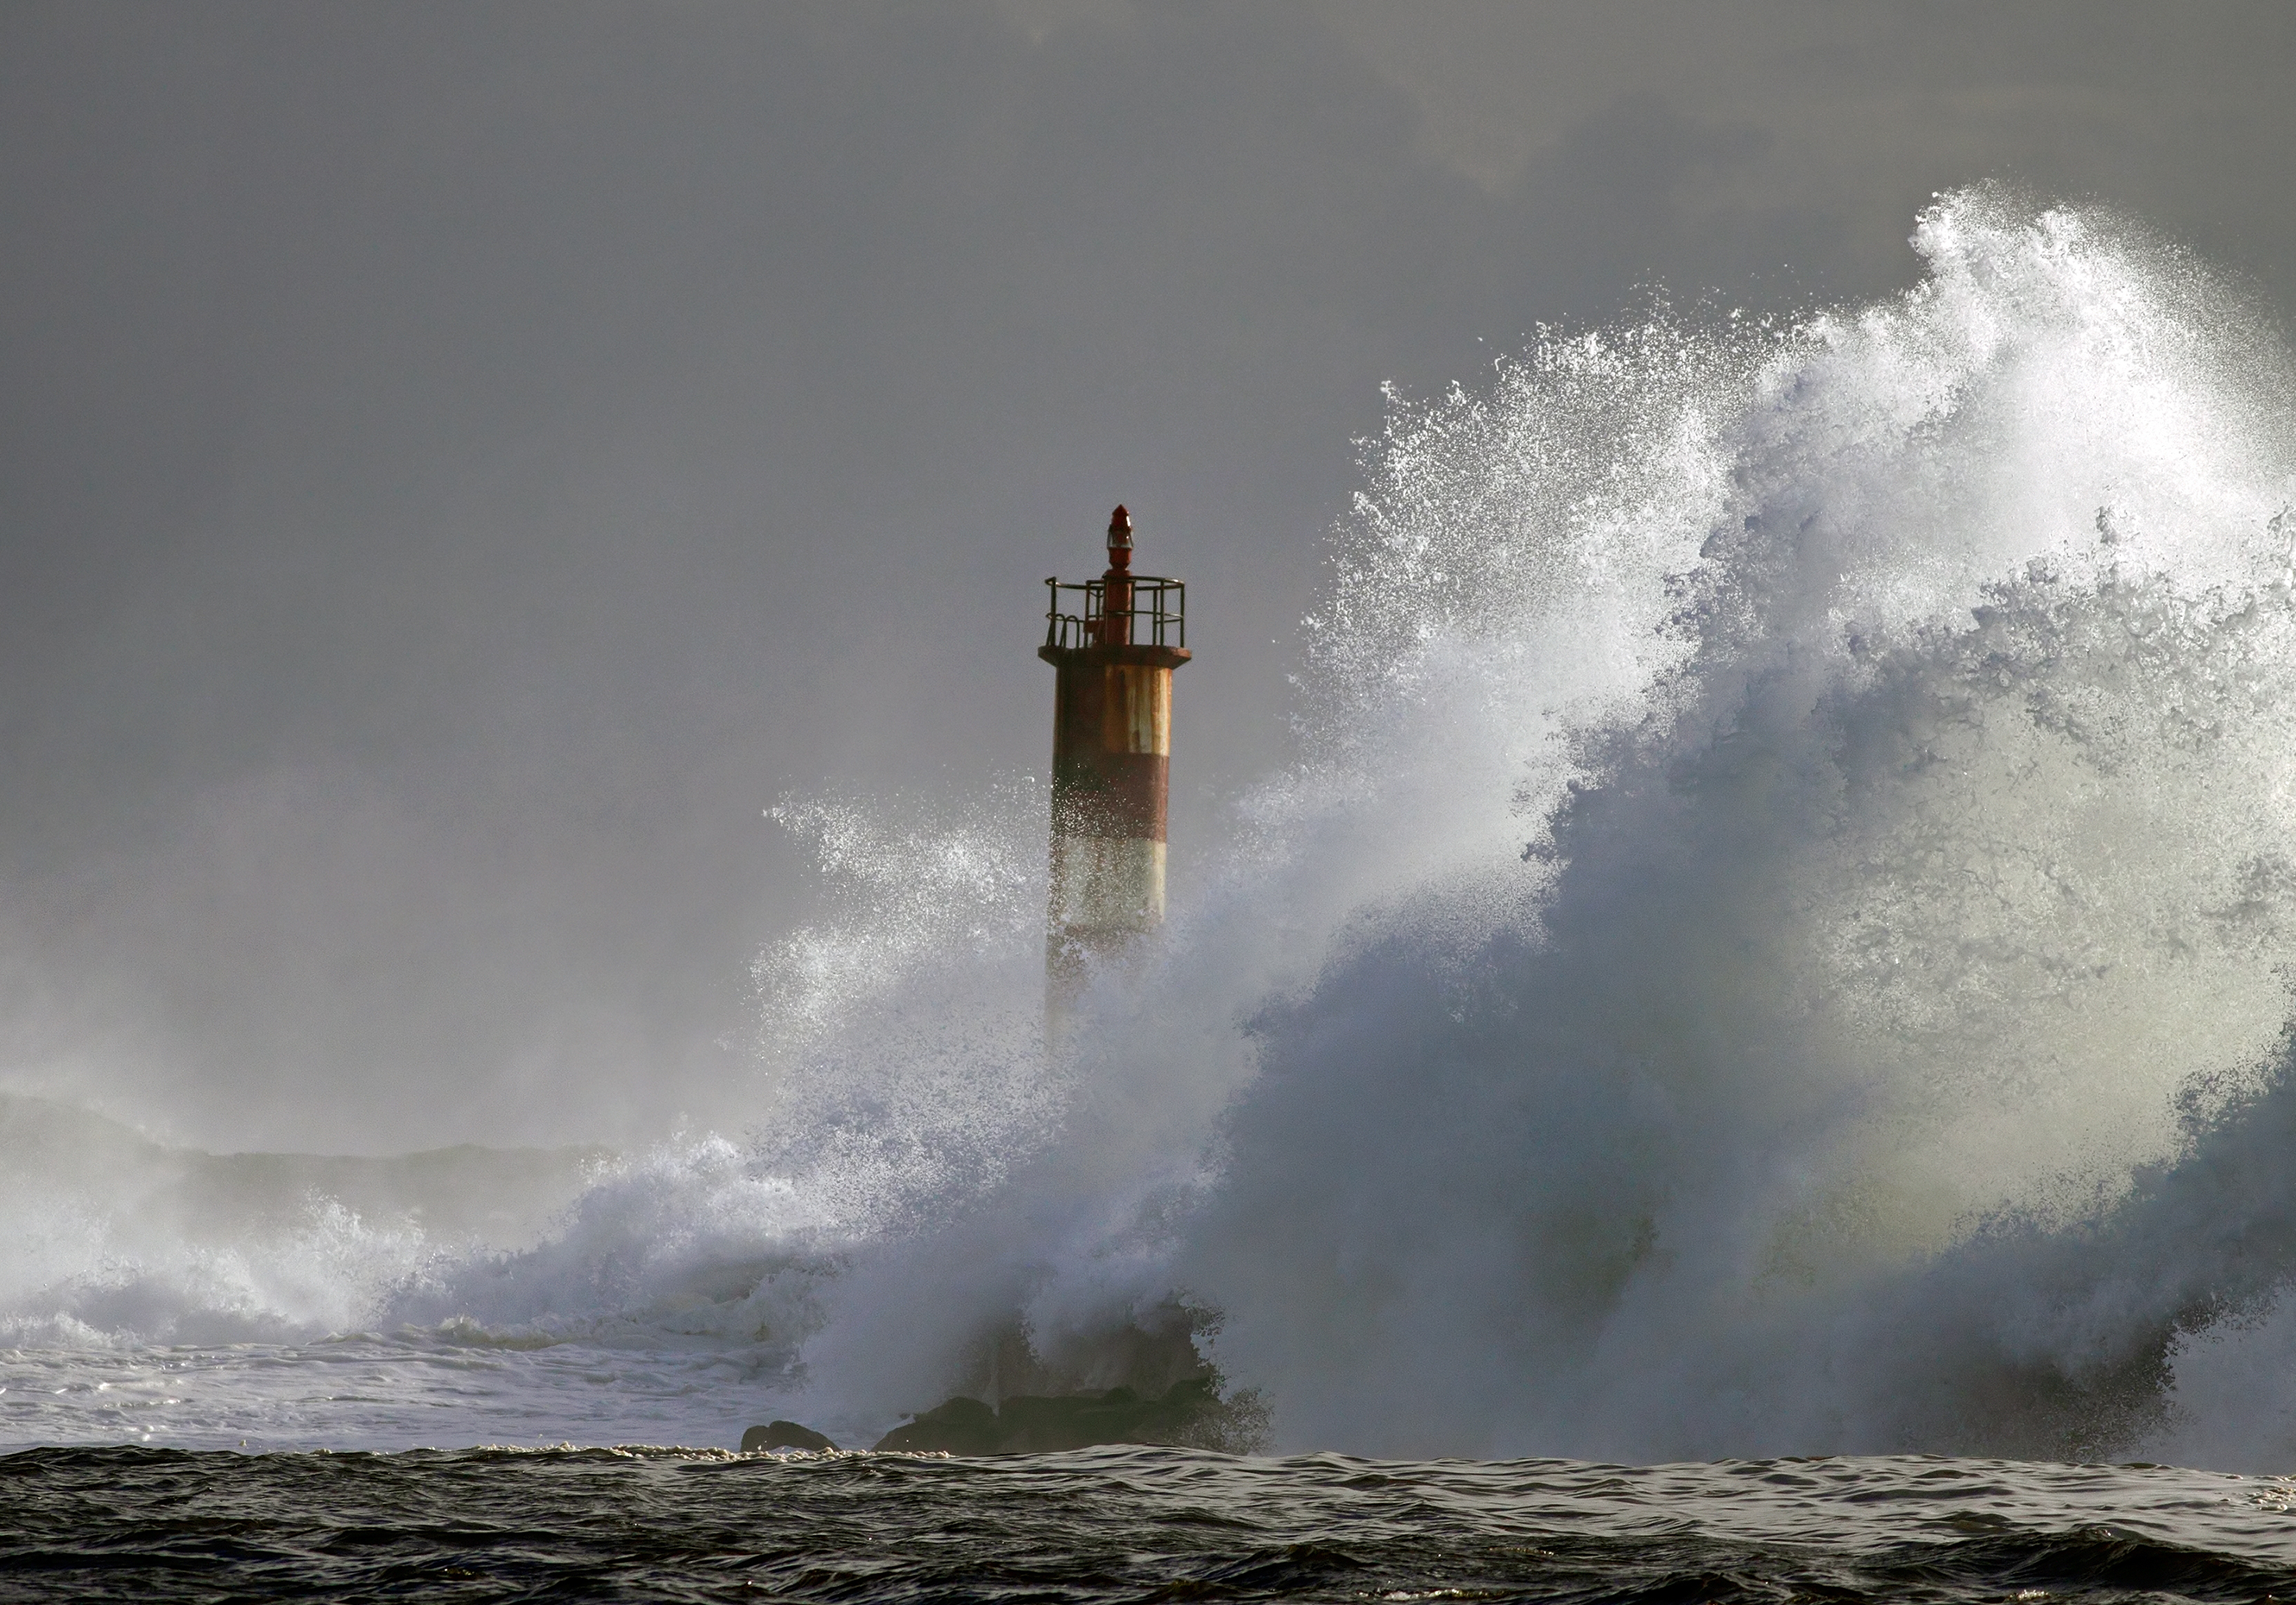
 In the event of a tsunami, knowing as much information as possible
can help to mitigate harm and damage.
Related:
Tsunami Risk: The Thunderbird and the Whale
How can insurers use tsunami map data?
Insurers can use the data provided by tsunami inundation maps to assess the risk of an exact location to help them to provide the right coverage to the right customers. In the event of an offshore earthquake, the maps also provide valuable information for insurers to assess the likely locations and severity of inundation so that they can begin organizing and allocating resources to the areas and customers who will need them, potentially hours before a tsunami even reaches land.
Though current tsunami inundation maps are still imperfect and cannot account for every scenario, the data they provide is proving to be a valuable tool to those in the insurance industry. Particularly for those of us in the Northwest, this is becoming an increasingly critical issue.
You can quickly and easily determine whether any location in Washington state has been mapped for tsunami risk and, if it has, whether it's at risk of inundation. Just login to WSRB.com to try QuakeScout today. For detailed instructions on how to use it, click here.