Throughout history, the evolution of mapping has closely mirrored the progress made in scientific understanding and technological advancement.
Consider this fascinating journey: geometrical concepts led to the compass which then paved the way for developing the Global Positioning System (GPS). Each step built upon the prior, forming a tapestry of breakthroughs that gradually unveiled the spatial dimensions of our world.
GIS, or Geographic Information Systems, stands as the latest innovation in this sphere; cutting-edge technology that takes all we've learned thus far and turns it up a notch.
What is GIS?
GIS represents the current culmination of mapping technology, built up and perfected over human history. Think of it as a dynamic map that's not confined to a static sheet of paper, but rather a flexible and adaptable tool that can span greater distances – both spatially and conceptually.
A working definition for GIS is offered in the 2006 text by Julliana Maatay and John Ziegler, GIS for the Urban Environment:
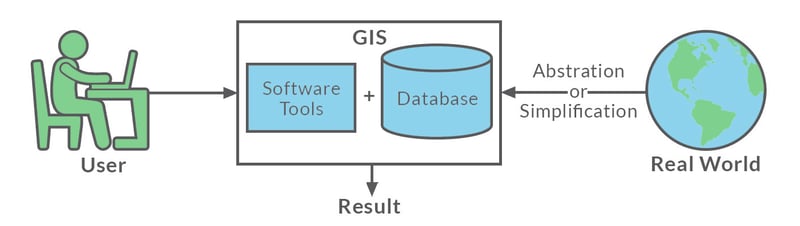
GIS is an integrated system of components - information about the real world that has been abstracted and simplified into a digital database of spatial and nonspatial features, which, in conjunction with specialized software and computer hardware, and coupled with the expert judgment of the GIS user or analyst, produces solutions to spatial problems.
Don’t worry if this all sounds a bit confusing. To better understand what all this means, let’s unpack it a bit.
The essence and practical application of GIS can be broken down into three core components: the database of real-world information, the software, and the user.
Database
GIS is fueled by data; to provide valuable insights, GIS requires a database of real-world information, consisting of spatial data (geographic features like points, lines, and polygons representing various elements such as buildings, roads, rivers, borders, and elevations) and non-spatial data (population demographics, land use types, and environmental factors). When combined, these data elements form a digital counterpart to our tangible world.
Software
The engine that drives that brings data to life, enabling users to input and manage information in one place. GIS software, such as ArcGIS by Esri, provides an accessible interface that allows users to interact with this data, create custom maps, conduct complex spatial analysis, and generate meaningful reports.
User
Individuals play a central role in the practical application of GIS technology. They're the ones who know how to work the software, keep the data up-to-date, and use their know-how to analyze things to get the results they want. The user is in the driver's seat: the computer and software alone cannot make sense of the data without an individual steering them in the right direction.
What results from the combination of database, software, and user is powerful insights that can drive decision-making.
GIS functionality
GIS technology has gained widespread adoption due to its versatility, and the ultimate application of these tools lies with the intent of the user; it's like a Swiss Army knife for mapping. Cartographers use GIS to create dynamic maps, operations managers use it for real-time tracking, and urban planners rely on it for geographic analysis and visualization.
Any application of GIS tools requires data collection from a variety of primary and secondary sources. Collected data is then turned into organized, spatially aware information that dances on your screen, producing insights through unique and functional maps.
The combination of GIS technology and old-school cartography has completely transformed mapmaking. Now, people can make and change maps in real-time; as the info gets updated, the maps automatically change too. And in these maps, details about places and things can be incorporated, organizing distinct data into layers for easy reference and analysis.
It's all a bit theoretical though, isn’t it? To further understand the functionality of GIS, let's explore how WSRB leverages this technology to improve the services we provide our Subscribers.
How WSRB utilizes GIS technology
Data Collection and Management
GIS technology enables WSRB to collect and manage vast amounts of geographic and non-geographic data relevant to property insurance. This data includes property boundaries, building characteristics, fire hydrant locations, fire station proximity, topographic information, and more. We can efficiently access and analyze the information needed for risk assessment and underwriting by centralizing and organizing this data in a GIS database.
Risk Assessment and Hazard Identification
By overlaying multiple layers of data, such as elevation and flood zones, WSRB can identify high-risk areas prone to disasters. This comprehensive risk assessment helps insurers set appropriate coverage levels and premiums, ensuring that policyholders are adequately protected.
Customized Underwriting
WSRB is able to generate customized underwriting solutions based on the specific risk profile of individual properties. We can provide insurers with detailed information about each property's unique characteristics by analyzing geographic data at a granular level, enabling tailored coverage options that accurately reflect the property's risk exposure.
Mapping and Visualization
Using GIS, we create digital maps and visual representations of spatial data. These maps are powerful tools for communicating complex information to insurers, agents, and other stakeholders in a clear and easily understandable manner. By visualizing risk concentration and hazard zones on maps, insurers can make more informed decisions and take proactive measures to mitigate potential risks.
Continuous Data Updates
The data we collect is not stagnant; GIS enables us to keep our database and maps up to date with the latest information. As new data becomes available, WSRB can quickly integrate it into the GIS system. This ensures that insurers have access to the most current and accurate data for risk assessment and decision-making.
Community Engagement
Visualizing risk concentration and hazards on interactive maps helps communicate the importance of preventive measures like defensible space and fire-safe building practices. We use these maps to engage with insurers, and the individuals and communities they provide coverage to, in order to raise awareness about fire safety and risk reduction.
So, there you have it – the magic of GIS. It's where data, software, and human interaction come together to create a symphony of insight, shaping the world, one map at a time.

[1] Maantay, J., Ziegler, J., and Pickles, J. (2006). GIS for the Urban Environment. ESRI Press.