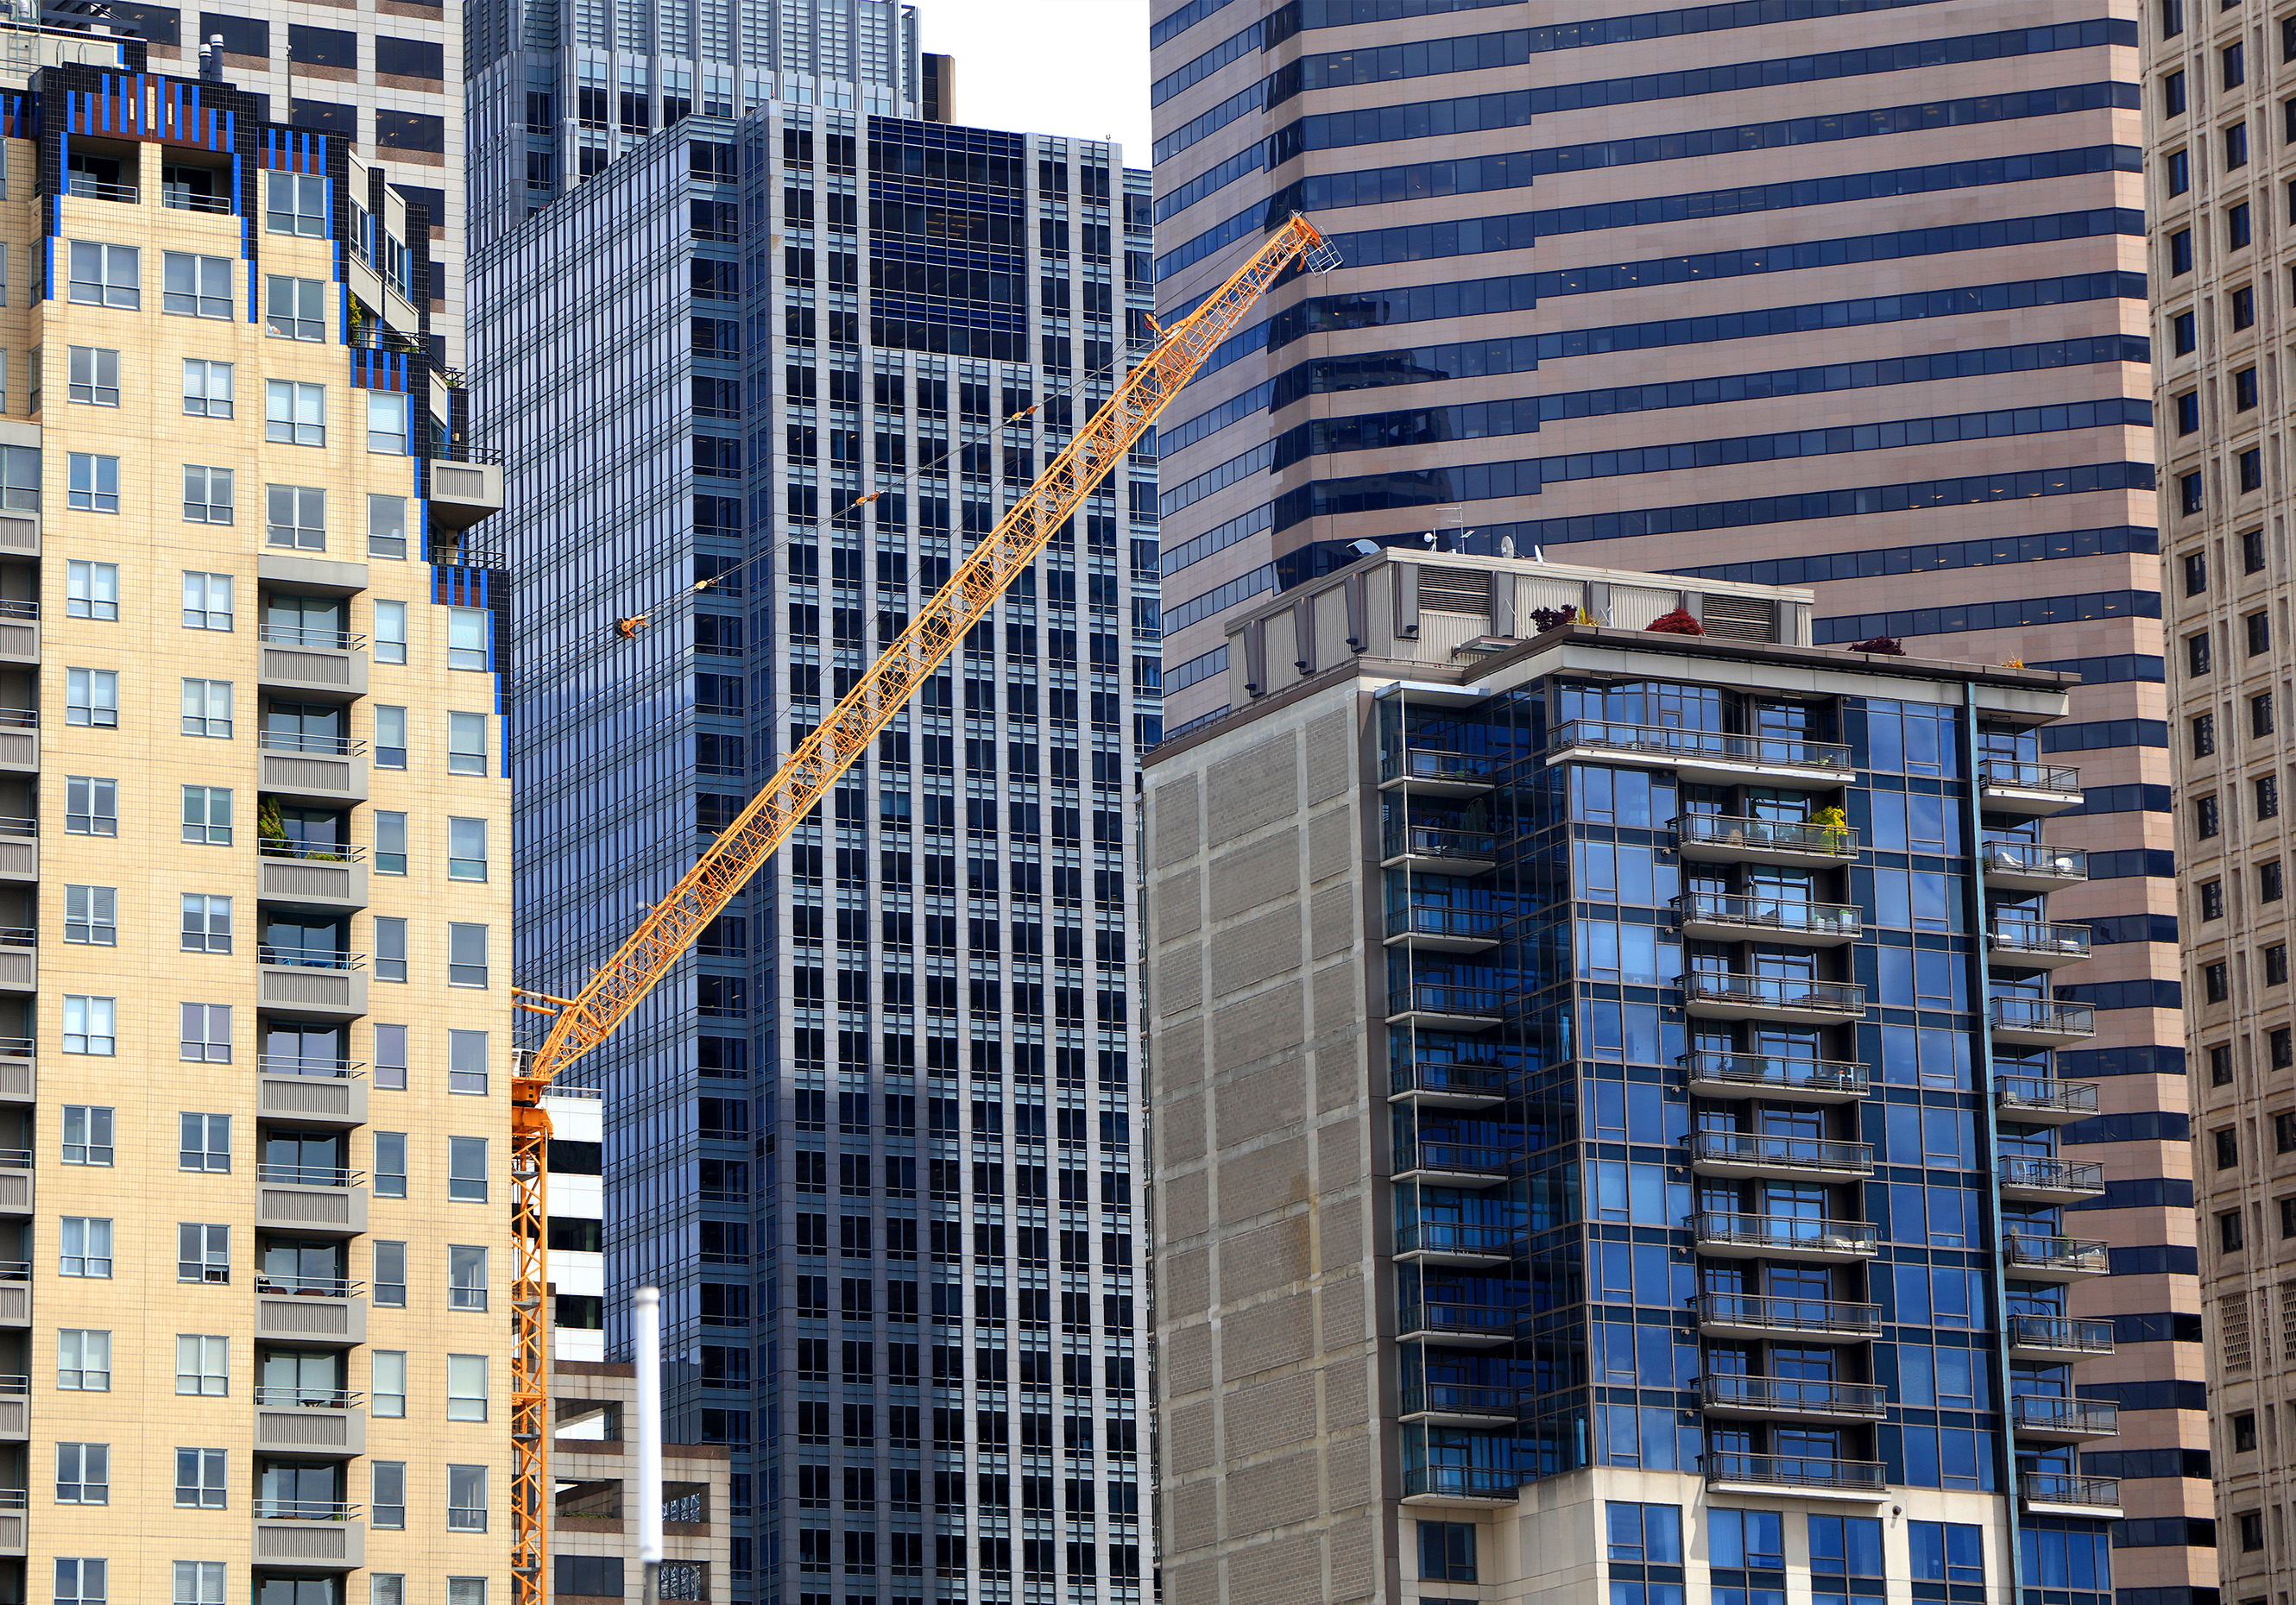
Wildfires have already burned through more than 2.4 million acres so far this year in the U.S., and fire season won’t end in some places for months.1 Future wildfire seasons are expected to be at least as severe, and potentially more severe, than the last few seasons. To help you and your customers manage this evolving risk, we’ve created a time-saving guide to useful resources.
Use this information to make more-informed underwriting decisions, reduce your concentration of wildfire risk and help your customers protect their homes and property.
As wildfires have become more frequent and intense in some areas, many insurance professionals and their customers have been trying to understand why so many acres are burning and why so many homes and businesses are being damaged or destroyed.
There is no single answer to these questions; instead, multiple important factors are at play, including increased development in wildfire-prone areas.
For many people, spending weekends in a small mountain town or living in an exurban community surrounded by a forest sounds ideal. These types of areas are in what’s called the wildland-urban interface (WUI), which is where wildland and development meet, and which has quickly added homes, businesses and residents over the past few decades.2
More people in the WUI means a higher risk of wildfires. Humans cause most wildfires and cause almost every wildfire that threatens homes,3 usually by burning debris or yard waste, setting off fireworks, burning campfires or using equipment that causes sparks. In some cases, humans set wildfires intentionally.
More buildings in the WUI means more property is at risk of damage or destruction. In a past blog post, we illustrated with satellite images some of the growth in the WUI.
Many wildland areas surrounding the WUI also have decades of accumulated underbrush that serves as fuel for wildfires. As a result, if a fire does start, it’s more likely to be severe than if that fuel had not accumulated. We explore how this accumulation occurred in our blog post on why so many buildings are being destroyed by wildfires. The post also takes an in-depth look at other factors driving wildfire frequency and severity, including warmer, drier weather.
You can gain insight into how much of your book of business is in the WUI with our Wildfire Risk Tool. It’s an easy lookup tool that’s available to all registered WSRB users. Have a large book of business you’d like assessed all at once? Contact us about a book review. You’ll find additional ways you can make a difference on wildfire risk right now in our CEO Perspective.
damage caused by wildfires.
As wildfires grow more frequent and cause more property damage, insurers are facing the risk of significant payouts and even potential failure. After the 2018 Camp Fire, Merced Property & Casualty Co. failed and was taken over by the State of California. The insurer faced $64 million in outstanding liabilities just in the City of Paradise but had only $23 million in assets.4
Merced’s failure likely had multiple causes, but taking on so much risk in a single, wildfire-prone area played a role in its demise.
Insurance companies of almost any size can face concentration of risk challenges like the one that stymied Merced. Risk saturation can arise for a few reasons. Underwriters often operate with at least some independence regarding which properties they take on yet typically lack clear visibility into the properties their colleagues are writing. So, each underwriter may take on only a small amount of risk in a wildfire-prone area, but the total amount the company takes on can quickly grow to an amount that’s difficult to manage. Explore a visualization of how this happens in our post on managing risk concentration.
Risk saturation also arises because traditional tools, like spreadsheets, aren’t well suited to measuring and managing concentration of risk, to which geography is an important contributing factor. Instead, a map is much more efficient. With the right map, you can quickly see and assess your concentration of risk.
Take, for example, the following map of the Cashmere area, which the Washington State Department of Natural Resources has identified as one of the top 25 places in the state to be exposed to wildland fire. Each orange house icon represents a property insured by a hypothetical company operating in the area.
of risk much more efficient than other tools like spreadsheets.
You almost instantly see the information that matters most from a risk concentration perspective: the total number of properties insured and their proximity to wildland areas. Compare that to examining hundreds or even thousands of rows of addresses and calculating distances in a spreadsheet. Take an in-depth look at how useful maps can be in our post on measuring and reducing your wildfire risk concentration.
We can help you measure and manage your wildfire risk concentration in two ways. We can map the results from our Wildfire Risk Tool for your book of business, so you see the properties you insure, whether they’re in the WUI and their proximity to recent wildfires. We can also consult with you on the power of advanced geospatial risk analysis tools and how they can help you.
For insurance agents, helping customers protect their homes from property damage can help homeowners and business owners prevent a policy non-renewal. Risk-mitigation steps may also earn customers discounts from an insurer.
These steps don’t have to be complicated to yield benefits. Maintaining a building and keeping the surrounding space free of combustible materials can help reduce the risk that it catches fire by giving embers and flames fewer opportunities to reach the structure.
The National Fire Protection Association (NFPA) developed a zone system to show homeowners how to create and maintain what’s sometimes called defensible space or the home ignition zone, which has three parts.
Get more detail on the home ignition zone and a specific checklist for each zone from the NFPA’s guide to preparing homes for wildfire. Share these resources with your customers who own property in wildfire-prone areas.
For people looking to build or renovate a home in a wildfire-prone area, home hardening can add another layer of protection. A hardened home has not only well-maintained defensible space surrounding it but also ignition-resistant construction features and materials within it.
A study conducted after the Camp Fire found that ignition-resistant building materials can reduce the chances a wildfire will destroy a home or other building. The study looked at buildings in the path of the Camp Fire and compared those that were constructed before 2008 to those built after. Why 2008? That’s the year California implemented more stringent building codes that required new construction in fire-prone areas to use ignition-resistant building materials.5
The results: 51% of the single-family homes built after 2008 were undamaged compared to just 18% of single-family homes built before 2008 and the implementation of the more stringent building codes.6
The study found that the benefits of using ignition-resistant materials did not appear to extend to mobile homes, perhaps because these homes sit near each other. Take a closer look at the study and other aspects of home hardening in our post on how homeowners can protect their properties from wildfire.
and maintaining defensible space around their homes.
If you have a customer who’s building or renovating a home in a wildfire-prone area, share information with them about building materials that can help reduce wildfire property damage risk. These include:
The Insurance Institute for Business and Home Safety provides a comprehensive guide that covers ignition-resistant and non-combustible building materials as well as other tips for reducing wildfire risk.
You can also encourage your customers to work with others in their communities to become a Firewise USA site. In these places, residents have taken community action to reduce the risk of wildfire property damage. At least one insurer now offers residents in Firewise USA communities a discount on homeowners policies.
Wildfire risk isn’t going away anytime soon, and we are here to help you and your customers reduce this risk and protect their property. In addition to the resources described above, the WSRB blog has an entire category on wildfire, as does the BuildingMetrix blog. Simply scroll down from the most recent story to see all the posts.
How else can we help you identify, assess or manage the wildfire risk in your book of business? Share your ideas with us today.
[1] National Interagency Fire Center, https://www.nifc.gov/fire-information/nfn
[2] U.S. Forest Service, https://www.fs.usda.gov/nrs/pubs/jrnl/2022/nrs_2022_carlson_001.pdf
[3] PHYS.org, https://phys.org/news/2020-09-humans-ignite-wildfire-threatens-homes.html
[4] CNN, https://www.cnn.com/2018/12/04/us/camp-fire-insurance-company-liquidation/index.html
[5] Denver Post, https://www.denverpost.com/2019/04/11/california-building-code-wildfires/
[6] Denver Post, https://www.denverpost.com/2019/04/11/california-building-code-wildfires/